Overview of steps:
- Enter Settings
- Enter Resource list with standard availability and allocate Capacity to Skills and Projects
- Enter vacation and overtime
- Enter Demand (tasks) data
- Refresh Calculations
- View Dashboard to evaluate plan
- Address any over-utilization and under-utilization
- View Calendar to ensure desired utilization at granular time periods
Step 1: Enter Settings
In the Settings sheet, we will enter the basic settings.
Planning Period
We will set the planning period by entering a Start Date and End Date. The template allows a maximum of 2-year planning period.
 Step 1 Enter Planning Period Dates
We will use a 3 month period from Apr 1, 2019 to June 30, 2019.
Weekends
In most work places, we have days during a week where we don’t work (also called weekends). We can choose which weekdays are weekends from the list of options available. The template will set the availability of resources to 0 by default.
If you don’t have any weekends, then leave this input blank. Just click the cell and press the Delete key. It will remove the contents of the cell. Please do not delete the column or row.

Enter Weekends
We will choose SAT & SUN as weekends for this tutorial.

Enter Settings – Weekends
If a resource works during a weekend day, we can enter that as overtime in the VACATION_OVERTIME sheet.
Excel Tables
In the next set of inputs, we use Excel Tables. Entering the data correctly inside the Excel tables is critical to the functioning of the template. If you are new to Excel Tables, please see our article on How to use Excel Tables for data entry?
Tip: Start entering data right below the Header of each Table
Holidays
Since most companies have holidays (other than weekends), it is important that we factor that in when we calculate capacity. We can enter our company holidays and the template will set the availability of resources to 0 by default on those days. Each holiday must be entered individually.
We will enter a couple of days in the Holidays table.

Step 3 – Enter List of Holidays
If a resource works during a holiday, we can enter that as overtime in the VACATION_OVERTIME sheet.
Projects
The template allows managing capacity for multiple projects.
We will enter 2 projects, to keep it simple.

Enter Settings – Project List
Skill Groups
Skill Group is how we can group resources for planning.
Skill Group and Skill are used interchangeably in the template.
In our example, we have resources from 2 skill groups: Project Mgmt and Development.
 Enter Settings – Skill Group List
Resources
Enter list of Resources available for planning.
The template uses the term ‘Resource’. The most commonly used resource in most scenarios is the human resource (can be called as Employee). But a machine could be a resource too. Hence instead of using ‘Employee’, the term ‘resource’ is generally used.
Let’s assume we have 6 resources in total.
 Step 6 – Enter list of Resources
Step 2: Enter Resources’ Capacity
Now, we move to the Capacity sheet in the template.
We must enter the resources, provide start and end dates of availability, available hours every weekday and other information related to capacity.
Tip: To help with data entry, you can copy the values you entered in the Settings sheet, for Resources, and then paste in the Capacity sheet. Please make sure that you paste as values.
After copying the values, right click on cell A4 in Capacity Sheet. In the menu that pops up, choose Values under Paste Options. This ensures that only the values are carried over, without impacting the formatting and drop-down validations.

Pasting Resource Names as Values
After entering resource names, we enter the Start Date of each resource.
Resources can be hired anytime and similarly resources may leave a company anytime. The template will assign 0 availability before start date and after end date.

Enter Resources Capacity – Available Work hours by Weekday
We enter the number of hours each resource will be available each weekday. For example, Project Planner 1 is available 8 hours a day from Mon to Fri. The template can handle varying hours by weekday as well.
We assign the 6 resources each to a Skill Group and Project.
We can provide the End Date of each resource if there is an End Date for the availability. If no end date is provided, the template will assume that the resource is available through the end of the planning period.
 Resources Capacity Table – Entered
Finally, we enter the Cost per Hour for each resource.
Important: The last column is a calculated field that is critical to the functioning of the template. Please do not edit/delete it. If you don’t want to see it, you can hide the column
How to allocate same resource to multiple skills?
You can allocate each resource to one or more skills.
To allocate one resource’s capacity to multiple skills, add a new row to the table and assign a different skill. Ensure the available work hours are distributed between the two skills.
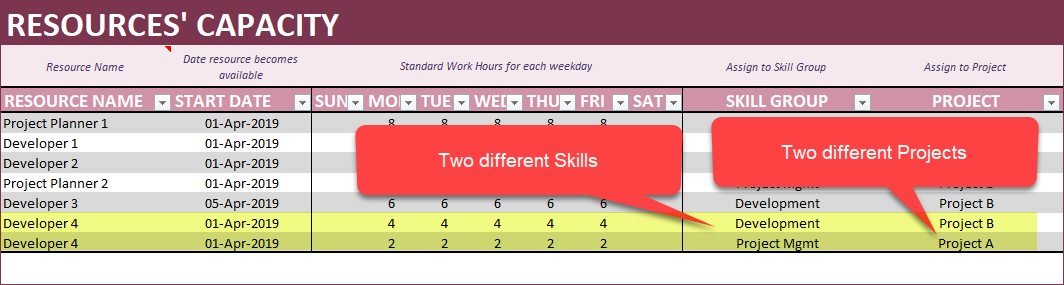
For example, if Developer 4 was available 6 hours in total and can perform Development role for 4 hours and Project Mgmt role for 2 hours, we would enter as shown below.

Entering same resource with multiple skills
Resource name will be same Developer 4, but work hours may vary, and Skill Group will be different. In this case, we assigned to same Project B.
How to allocate same resource to multiple Projects?
You can allocate each resource to one or more Projects.
To allocate one resource’s capacity to multiple projects, add a new row to the table and assign a different Project. Ensure the available work hours are distributed between the two Projects.
For example, if Developer 4 was available 6 hours in total (Development skill), and will work 4 hours for Project B and 2 hours for Project A, we would enter as shown below.
 Entering same resource with multiple Projects
Resource name will be same Developer 4, but work hours may vary, and Project will be different.
How to allocate same resource to multiple Projects and Skills?
You can allocate same resource to one skill in one project and a different skill in another project.
For example, if Developer 4 was available 6 hours in total, and will work 4 hours in a Development role for Project B and Project Mgmt role for 2 hours for Project A, we would enter as shown below.
 Entering same resource with multiple Projects and Skills
 How to shift same resource to a different Project after a certain date?
If we want a resource to work in one project for a certain date range and then change to a different Project, we can use the same approach. We can use the END DATE column to enter the end date of a certain Project assignment and then enter a new row with a different project.
 Assigning a resource to different projects over time
In the above illustration, Developer 4 works on Project B for 6 hours a day until 30th Apr. From May 1st, the resource works 6 hours a day on Project A.
You can apply the same method if you want a resource to change skill from a certain date.
Let’s go with the simple setup now where each resource is assigned to only one skill and one project.
Step 3: Enter Vacation and Overtime
Though we have entered standard availability above, we know that employees may take vacation or sometimes work overtime.
We can enter any vacation or overtime taken by resources in the VACATION_OVERTIME sheet.
 Enter Vacation Overtime taken by Resources
Project Planner 1 is taking 3 days off (8 hrs each day) from 16th Apr to 18th Apr.
Two important things to note here:
- It is 8 hrs of vacation each and hence totally 24 hours in total for all 3 days. However, we only enter 8 hrs as the column is for daily hours. The template will calculate automatically the total.
- If the employee’s vacation hours vary over the three days, then we must create separate rows.
- We enter -8 since it is vacation. If it is overtime, we will enter 8.
- If vacation hours for a day is greater than the standard availability of that resource, then the result will be set to 0 to avoid negative availability.
Project Planner 2 is taking one day off (8 hrs) on 21st May. We enter 21st May as Start and End Dates. It is important that we fill both dates.
Finally Project Planner 2 also does overtime on 25th May. We enter 8 (not -8) in Hrs, since this is overtime.
This 25th May is a Saturday and is a weekend day. However, overtime can be done on weekends and holidays as well. The template supports that.
Overtime is positive to capacity and Vacation is negative to capacity.
This completes our capacity inputs. Now, we move to the Demand data input.
Important:
If you have assigned a resource to multiple skills and/or projects, you will have to enter vacation or overtime separately for each combination. This allows more flexibility in capacity planning as you can enter overtime only for a certain project instead of both projects (assuming resource assigned to 2 projects).
Step 4: Enter Demand data
In this template, demand is entered as Tasks in the Demand sheet.

Enter Demand as Tasks assigned to Resource Project and Skill.
Required fields: Date of the task, Resource assigned to do that task, Hours of work required, Project assigned and Skill Group.
Detail column is optional to enter any details about the task or any notes.
The three calculated cells on the right should not be edited or modified. That would break the functionality of the template. Please do not delete or edit these columns.
. Do Not Edit Calculated Fields
Planning granularity
An important concept to understand is planning granularity. We have entered daily level of tasks in the above image. What level of tasks to be entered depends on the planning granularity you need.
When we say ‘weekly planning’ it means that our goal is to ensure all the tasks for the week are completed by end of week. If we are behind on Monday, Tuesday or Wednesday, that is okay. As long as we complete by end of week, we will be accomplishing our goals. In this scenario, you don’t have to enter daily level tasks. You could enter just one record for a resource for each week.
If you want to ensure you will be meeting your demand every single day, then, you should enter daily tasks individually.
Thus, the template can accommodate more granular demand entry (daily – even multiple tasks per day) or aggregated demand entry (weekly or monthly or quarterly).
Once we complete entering the demand, we are done with data entry.
Step 5: Refresh Calculations
The template uses pivot tables and hence every time we change input data, please refresh calculations.
Data ribbon –> Refresh All.
 Refresh All calculations
Step 6: Review Dashboard
Dashboard
Dashboard sheet shows the summary of metrics across all projects, skills and resources.
 Capacity Planning Dashboard
On the left side, you will have the slicers (filters) that you can use to drill down to specific Project(s), Skill group(s) and Resource(s).
 Dashboard Slicers
At the top, you will see the overall summary of metrics.
 Capacity Planning Dashboard – Summary Metrics
You can see the number of Projects (2), Skills (2) and Resources (6) in the Plan.
On the left side, you can see the Capacity (2472 hrs), Demand (2287 hrs), Surplus of 185 hrs at 93% Utilization Rate.
On the right side, you can see the same metrics – based on Cost. The resources available cost totally $25,554 while the demand tasks will cost $23,273 resulting in a surplus of $2,281 at 91% utilization.
We also see that there are 2 over utilized resources and 3 under-utilized resources.
Why is this important?
The overall aggregate utilization rate will not provide the complete picture. If there is a Developer resource who is over utilized (utilization rate > 100% or capacity < demand) has 50 hrs over utilized and another Project Mgmt resource who is under-utilized (utilization rate < 100% or capacity > demand) with 50 unutilized hrs, they cancel each other when we aggregate. Though the overall utilization rate may be 100%, individual resources have surplus and deficit and that must be addressed.
Hence it is important to view utilization at resource level.
 Project level Capacity vs Demand
The above visual presents the capacity vs demand for each of the Projects.
On the left, you will see projects where there is deficit – that is, capacity is less than demand. In this case, we don’t have any.
A project will either be in deficit or surplus – not both.
On the right, you will see projects where there is surplus – capacity is greater than demand. Project A has capacity of 1236 hours while demand is only 1097 hours. The surplus is 139 hours.
Project B has capacity of 1236 hours while demand is only 1190 hours. The surplus is 46 hours.
 Skill level Capacity vs Demand
The above visual presents the Skills which are over utilized (on the left side) and under-utilized (on the right side).
Development has a total capacity of 1488 hours but demand of 1495 hours. 7 hours overutilized (deficit).
Project Mgmt has a total capacity of 984 hours but demand of 792 hours. 192 hours under-utilized (surplus).
A Skill Group will be in Surplus or Deficit or neither; never in both.
Resource table shows which specific resources are over utilized and under-utilized.
 Resource level Capacity vs Demand
Clearly two resources Developer 3 and Developer 2 do not have enough capacity to complete the tasks assigned to them. Meanwhile, 3 other resources have a lot of additional hours available but not utilized.
In the next page of the dashboard, you can see the charts of Capacity vs Demand in Hours.
The charts show the overall capacity vs demand for each Project, Skill group and Resource.
 Capacity Planning Dashboard – Hours – Capacity vs Demand – Charts
In the final page of the dashboard, you can see the charts of Capacity vs Demand in Cost.
The charts show the overall capacity vs demand for each Project, Skill group and Resource.
 Capacity Planning Dashboard – Cost – Capacity vs Demand – Charts
The Dashboard has so far given us a good overview of our plan and identified 2 over-utilized resources which need to be addressed.
3 resources have unutilized hours that will be costing the team. In this tutorial, I am assuming the under-utilization is not a major concern. In some project scenarios, underutilization can also be an issue. You can follow similar steps as explained below to address that too.
Now, let’s see how the template will help us address this.
Step 7: Addressing Over-utilization and Under-Utilization
In order to address the over-utilization and under-utilization, we must do one or more of the following:
- Change Capacity
- Adjust standard availability of resources in the Resourcessheet.
- Increase (to increase capacity) or Decrease (to reduce capacity) available hours
- Add overtime (to increase capacity) or vacation time (to reduce capacity)
- Adjust standard availability of resources in the Resourcessheet.
- Change Demand
- Change the demand hours if possible. This would reduce the demand and allow the capacity to fulfill the demand.
- Change Allocation/Assignment
- Change assignment of tasks (demand) to a different resource.
- Change capacity allocation of resource to Projects.
The first option Change Capacity is straight forward and don’t need much explanation. The impact is that it will cost more to increase capacity.
The second option Change Demand is also straight forward to implement in the template (update the demand sheet), though it may be hard to get project stakeholders to reduce the demand (or scope).
We will focus on the 3rd option which may neither increase the cost nor reduce the demand. It is the re-assignment of capacity and demand (tasks) to existing resources to remove over-utilization.
Changing Assignment of Tasks to a Different Resource
Let’s filter the dashboard to Project A by using the slicers on the left of the Dashboard.
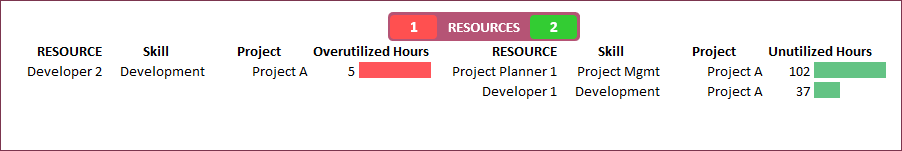
The Resources table shows the following.
 Assigning Resources in Project A – Capacity Planning
 Developer 2 is overutilized by 5 hours while Developer 1 has 37 unutilized hours.
In the Demand sheet, Filter to Resource Developer 2. Find a task for 5 Hours and re-assign to Developer 1.
 Reassigning a task to Developer 1
Let’s refresh the calculations. Data ribbon –> Refresh All.
That will update the dashboard calculations.
 Project A – Resource – Capacity vs Demand – After assignment
Now, there are no overutilized resources in Project A.
Let’s clear the Project filter in Dashboard.
Now, this is what the Resources table shows.
 All projects – Resource – Capacity vs Demand
Developer 3 has 39 overutilized hours, but we don’t have a Developer with that many unutilized hours.
Project Planner 2 who also works on Project B has 85 unutilized hours. To demonstrate how this template can handle a resource having multiple skills, we will assume that Project Planner 2 can handle Development tasks.
Now, we need to assign some of the capacity of the Project Planner 2 to Development skill.
 Assign Project Planner 2 Development capacity
Important things to note here:
- A new record must be created in the Capacity Sheet as shown above (last row). Resource Name will be same, but Skill will be Development. Cost can vary and can be entered any value.
- When we enter the standard work hours of the new record (we have entered 1 hour a day), we must review the work hours already assigned for the resource (Project Planner 2). Previously Project Planner 2 had 8 hours a day availability. We have updated that to 7 hours for Project Mgmt and assigned 1 hour to the Development. This assumes that the resource is still working same total number of hours. It’s just that we are changing the skill being used.
- When you split a resource to multiple skills or projects, check the Vacation/overtime sheet and update if that resource has Vacation/Overtime entries.
- In this case, Project Planner 2 has vacation and overtime entries. We create additional entries for the new skill and update the previously entered entries.

Review Vacation and Overtime entries when splitting resources
Now that we have created the capacity allocation for Development skill, we need to assign tasks from Developer 3 to Project Planner 2 in Demand Sheet. Select enough tasks to switch to overcome the overutilization.
 Assign tasks from Developer 3 to Project Planner 2
Let’s refresh the Dashboard again.

All projects – Resource – Capacity vs Demand – Final
We have no resources over utilized.
Overall metrics look like below.
 Capacity Planning Dashboard – Summary Metrics – After Optimization
All the resources will have enough capacity to meet the demand. We have 185 hours surplus capacity and are at 93% utilization.
This was just an illustration of how to use the template to modify capacity and demand. The target utilization rate can vary in each organization.
The Dashboard provides the metrics for the entire planning period duration in aggregate. If, in your organization, it is important to ensure a certain utilization every day, then you can update the planning period to a day or use the Calendar sheet to view capacity/demand at a daily level.
Step 8: View Calendar for granular time periods
Calendar is very flexible as it has many options to choose from. It also has the slicers (filters) just like the Dashboard.
The below shows the capacity in hours for each resource every week.

Calendar – Capacity by Resource – Hours – Weekly
There are four selections (Dimension, Measure, Unit, Time Dimension) to make and each selection has several options.
 Resource Capacity Planner Calendar Settings
Dimension
The calendar can be created for the list of resources or list of skill groups or list of projects.
 Calendar Settings – Dimension Resource Skill or Project
Measure
You can select to display Capacity data or Demand data or Surplus/Deficit data.
 Calendar Settings – Measure Capacity Demand or Surplus Deficit
Unit
The options for Unit are Hours and Cost.
 Calendar Settings – Unit Hours or Cost
Time Dimension
Finally, you can choose to show daily, weekly, monthly, quarterly or annual data.
 Calendar Settings – Time Dimension Daily Weekly Monthly Quarterly or Annual
The template will display up to 53 periods (53 days, 53 weeks, 24 months, 8 quarters, 2 years).
When you make the selections, the calendar display will update automatically to reflect the selections.
For example, let’s see Surplus/Deficit Hours by week.
 Calendar – Surplus Deficit by Resource – Hours – Weekly
We can see that though overall there may be no deficit for a resource based on total hours, some weeks have deficit which are made up by surplus capacity in some other weeks.
If we want to ensure that the team completes the tasks every week, then we need to follow the steps outlined earlier on modifying the capacity or demand.