In this article, we will cover the reporting available in the Retail Business Manager Excel Template.
Retail Business Manager Excel Template – Product Page Support Page
We have extensive reporting automatically generated, to help us get an accurate view of business performance in multiple areas (inventory, sales & finance) from multiple dimensions (product and partner).
VIDEO DEMO
There are six pages in the Report sheet.
Current Status
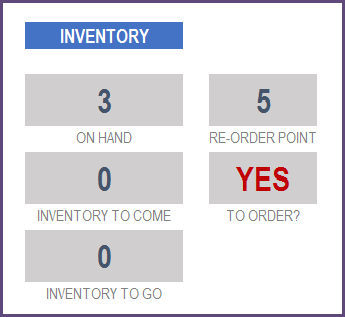
First, we can see the current status of inventory and finance.
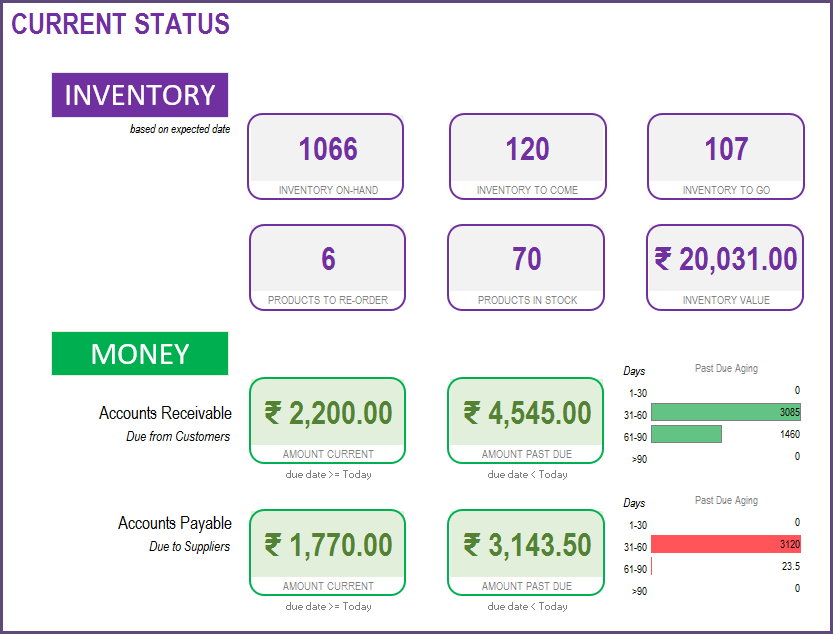
We can see the following metrics.
- Total inventory on hand Quantity of products currently on hand
- Total inventory to come Ordered from suppliers already and will reach our inventory in future
- Total inventory to Go Ordered by customers already and will leave our inventory in future
- Products to re-order Products whose inventory on hand is <= Re-Order Point (To view such products, we can go to the Products sheet)
- Inventory Value Value of inventory on hand calculated based on current purchase price of the products on hand
- Accounts Receivable – Current Amount due from Customers on Orders with Due Date >= Today
- Accounts Receivable – Past Due Amount due from Customers on Orders with Due Date < Today
- Accounts Payable – Current Amount due to Suppliers on Orders with Due Date >= Today
- Accounts Payable – Past Due Amount due to Suppliers on Orders with Due Date < Today
We can also see the breakdown of aging (1 to 30 days, 31 to 60 days, 61 to 90 days, >90 days) of those due amounts.
Summary
Now, we move to looking at the past performance of business. First, we select our report start and end dates.
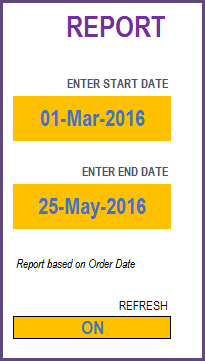
We leave the REFRESH to be ON, by default.
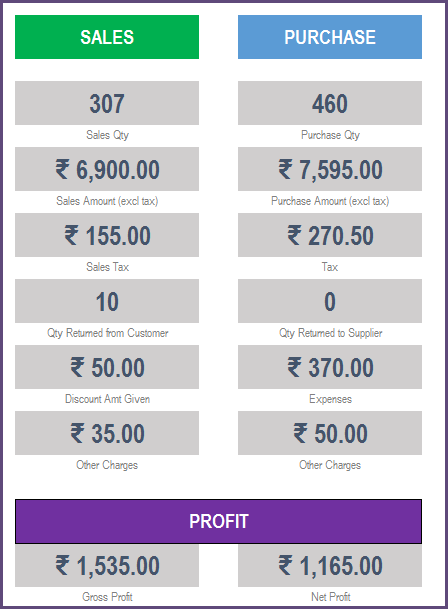
Metrics
All the metrics will be calculated on Orders with Order Date from start date to end date
SALES
- Sales Qty Total of quantity on Sale orders. Considers returns as well.
- Sales Amount Total Order amount on the Sale orders. Includes product level discounts. Does not include tax, order level charges and order level discounts.
- Sales Tax Total tax amounts on Sale Orders
- Qty Returned from Customer Quantity returned by customers
- Discount Amt Given Total amount of discount given to customers
- Other Charges Total of Other charges on all Sale orders
PURCHASE
- Purchase Qty Total of quantity on Purchase Orders. Considers returns as well.
- Purchase Amount Total Order amount on the purchase orders. Includes product level discounts. Does not include tax, order level charges and order level discounts.
- Tax Total tax amounts on Purchase Orders
- Qty Returned to Supplier Quantity returned to suppliers
- Expenses Total amount of expenses from start date to end date
- Other Charges Total of other charges on all Purchase orders
PROFIT
- Cost of Goods Sold is the sum of purchase price of products sold. Purchase price is the price of product as of Sale order date.
- Gross Profit Sales Amount – Cost of Goods Sold
- Net Profit Gross Profit – Operating Expenses
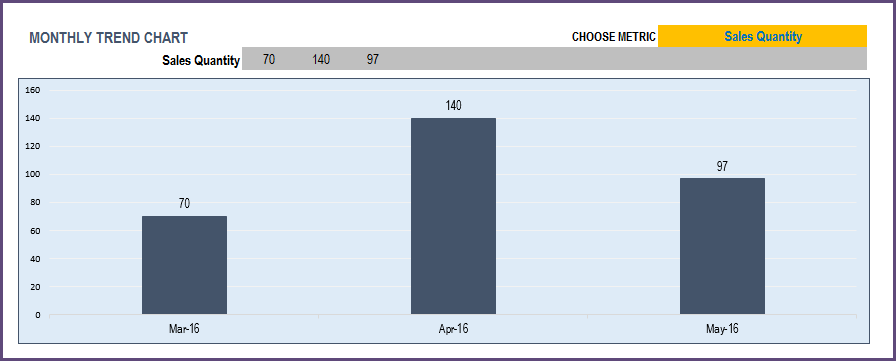
Monthly Metrics
We can view all the metrics by month for up to 12 months.
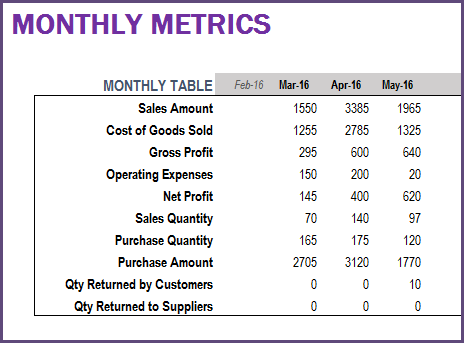
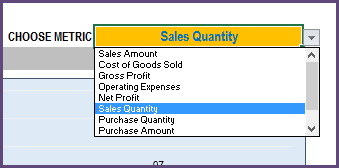
We can choose one of the metrics to update the chart that shows up to 12 months of trend.
Products – Top Performers
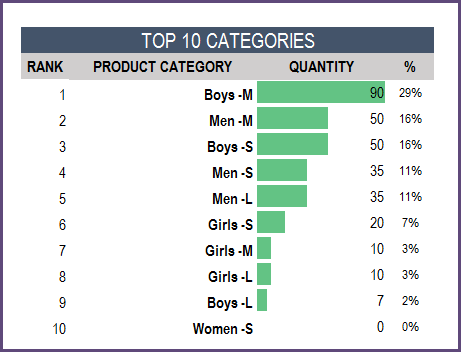
One of the important pieces of understanding business performance is knowing which products are selling the most and which ones are not. We have 3 ways of measuring sales – Quantity, Amount and Margin. This allows us to understand the true impact of the products to the business.
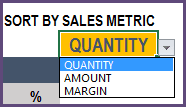
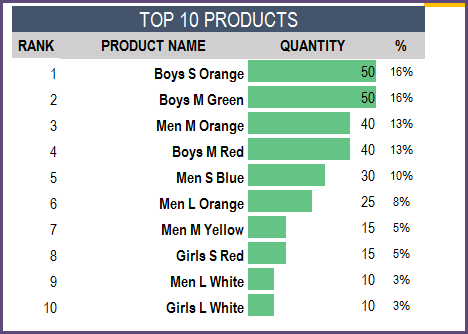
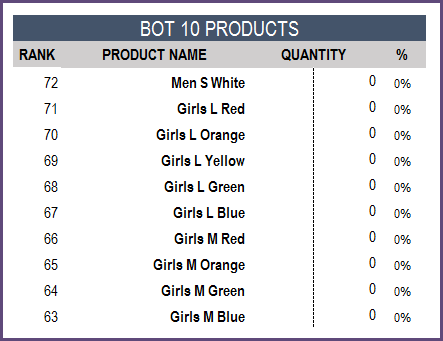
In this sheet, we will see the top 10 product categories and bottom 10 product categories.
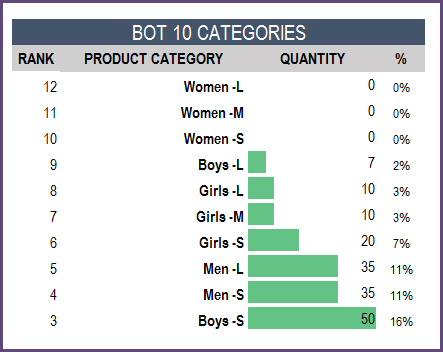
We can also see the top and bottom performing products.
Product Performance
In addition to that, we would want to look at a specific product and understand its performance. We can choose a product and see its performance summary during the reporting window.
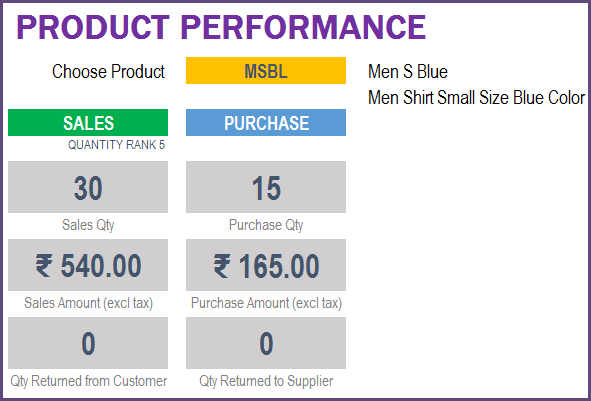
We can see the current inventory status of the product.
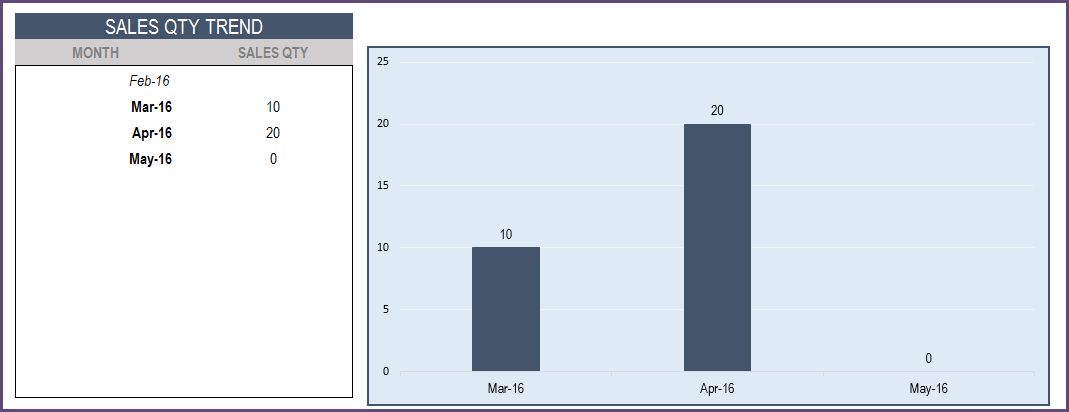
We can also see the sales quantity trend by months of that product.
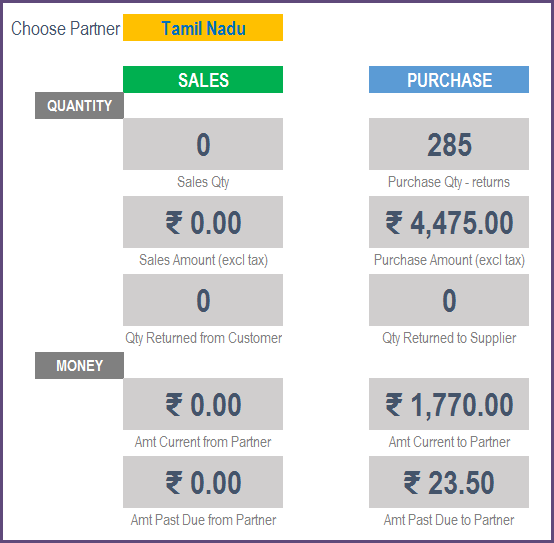
Partner Performance
Another important aspect to understand is best partners (customers and suppliers).
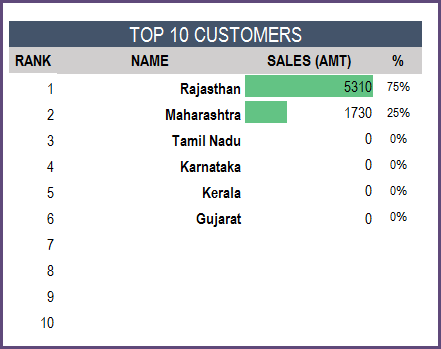
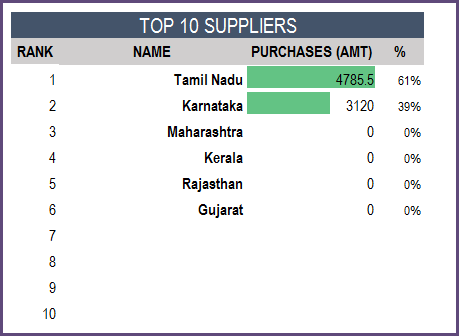
We can choose one specific partner and see their details as well.
Finally, the Products sheet, the Partners sheet and Order Headers sheet also have useful information that we can filter on to get to the data we need.