HIGHLIGHTS
CREATING THE MAP
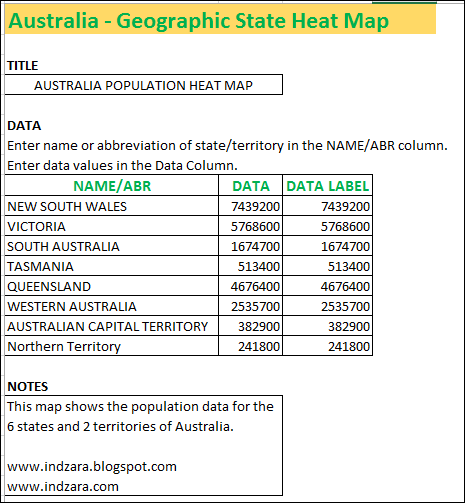
- Enter Title that you would like to appear on the map.
- Enter the data
- Enter name of state/territory in the NAME/ABR column. You can also use the abbreviations instead of full name. Allowed names and abbreviations are provided at the bottom of the template.
- Enter data in the DATA column.
- Enter data label that you would like to appear on the map for each state/territory. DATA LABEL’ can be different from the ‘DATA’. This is helpful in cases where you would want to display some text/number that is different from the actual data. The data will be used for coloring while the data label will appear on the map.
- Enter NOTES that will appear at the bottom left of the map. You can use this to write commentary about the data used for the map.
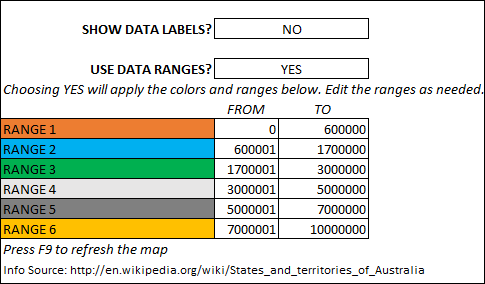
- If you would like to show data labels on the map, choose ‘Yes’.
- The template by default provides gradient red (low) to green (high) color scale. You can change that and use a custom 6 color option. In order to do so, choose YES for USE DATA RANGES?
- Colors cannot be changed here but the ranges can be edited
- The map should automatically update after any changes to data. If the map doesn’t update, please press F9 to refresh.
PRINTING
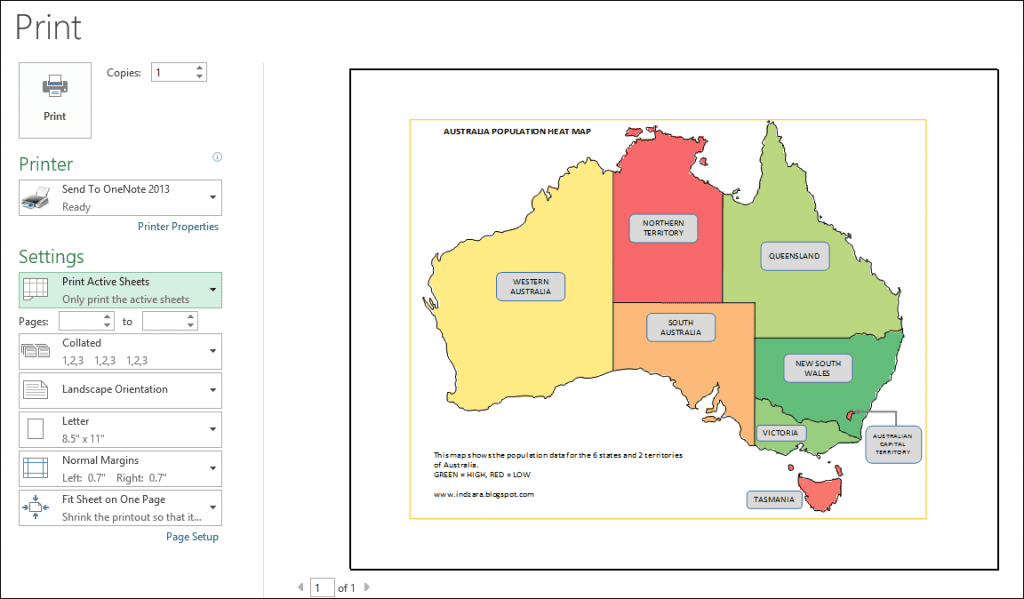
In Excel, when you try to print, the print area in the file is already pre-set to print only the map.
SAVING AS PDF
You can save as PDF and then e-mail it. By default, only the map will be saved in the PDF.
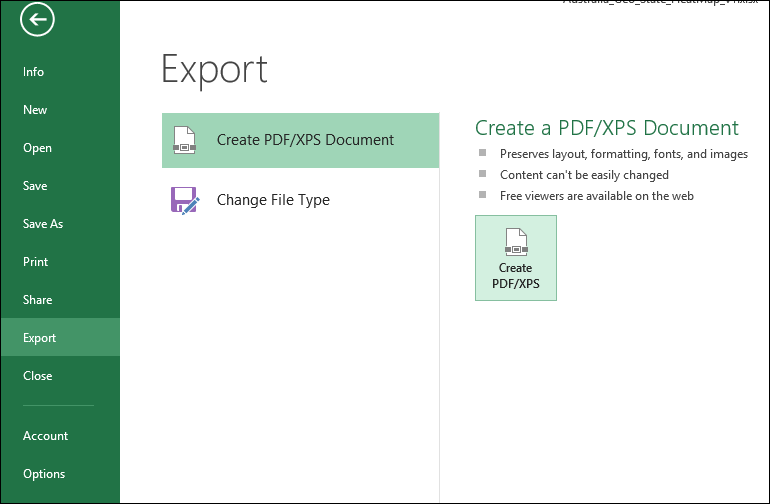
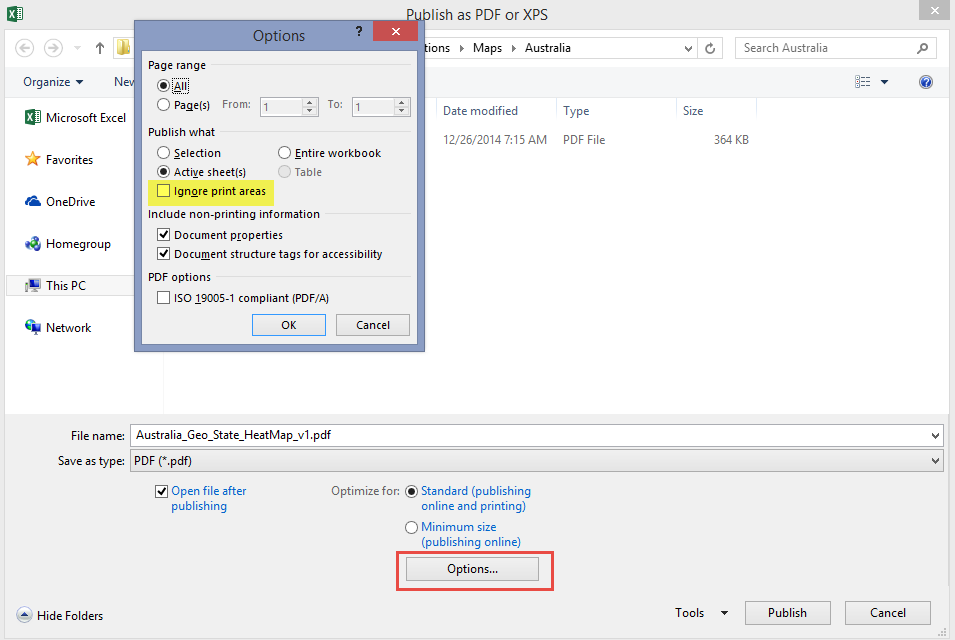
If you would like the entire sheet to be saved in PDF, choose Options and check the ‘Ignore Print Area’ option.
COPY/PASTE
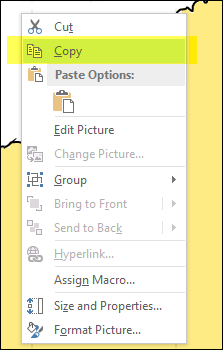
You can also copy the image by right clicking on the map and choosing ‘Copy’. You can then paste in other applications such as PowerPoint and Word.
CHANGING GRADIENT COLORS
If you would like to change the gradient colors used, please follow the steps outlined below.
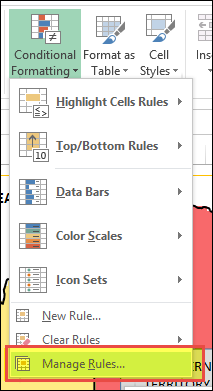
1. Open the Conditional formatting menu in the Home ribbon and choose ‘Manage Rules’.
2. Choose Sheet: Map Build

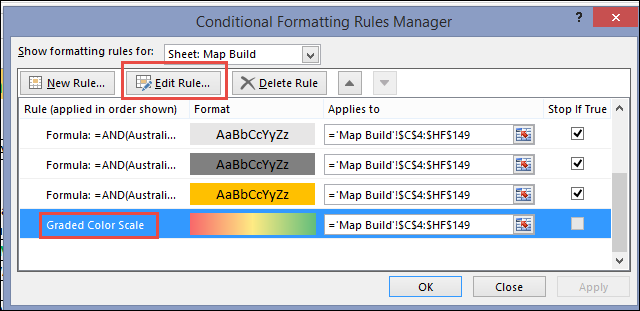
3. Click on the Graded Colour Scale rule and then click ‘Edit Rule’.
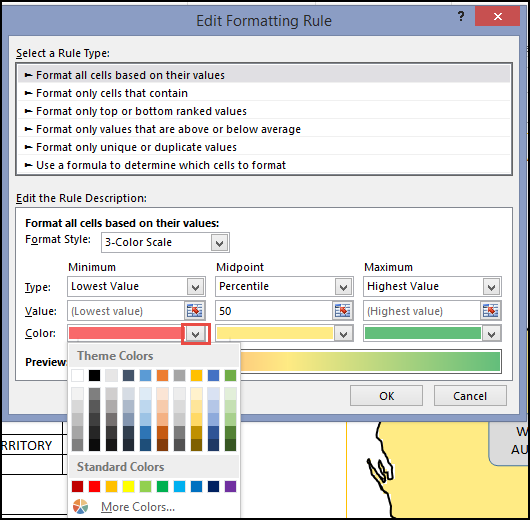
4. Change the colours (for minimum, midpoint and maximum) as needed. Then, Click OK.
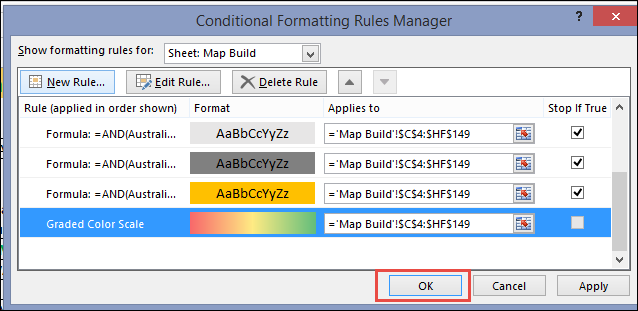
5. Click OK in the next dialog box to apply the changes.
CHANGING COLORS FOR DATA RANGES
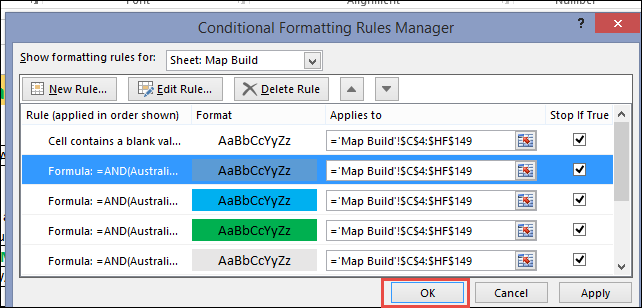
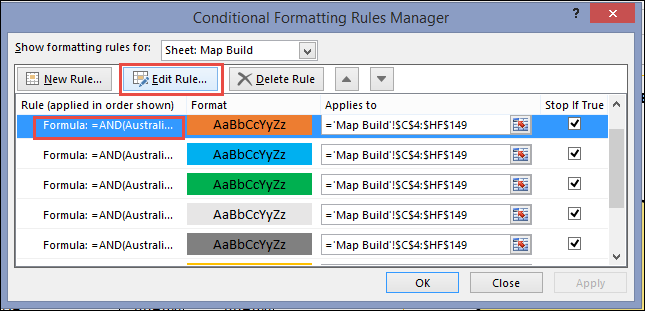
To change the colors used in the custom data ranges , in the Conditional Formatting Rules Manager, click on the rule associated with the color you would like to change. In the screenshot, we are changing the Orange color.
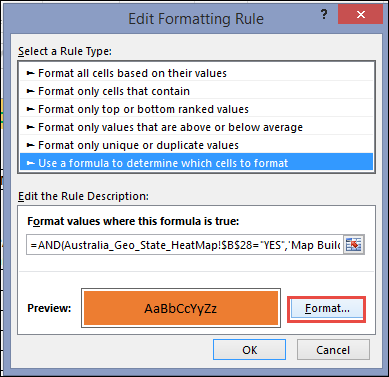
In the Edit Formatting Rule dialog box, click on ‘Format’.
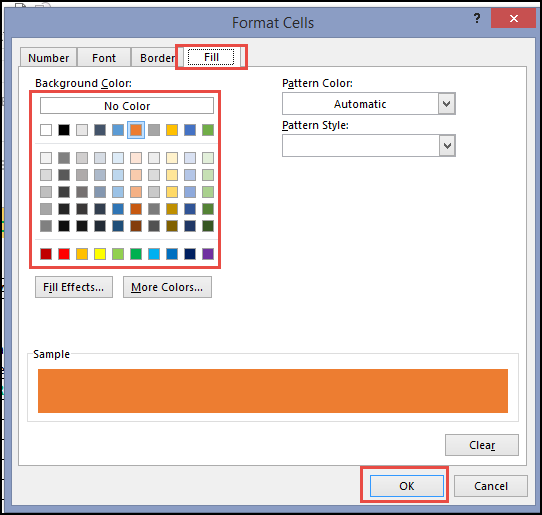
Select the ‘Fill’ tab and then select any background color. Then, click OK.
Click OK in the next dialog box.
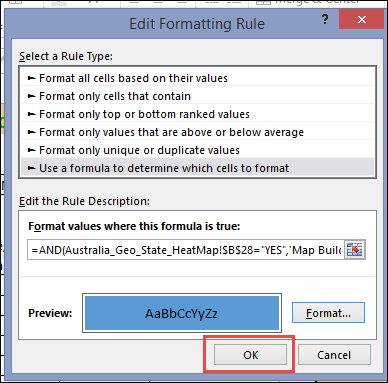
Click OK in the next dialog box. This would apply the chosen color.
