What is SMA indicator?
A Simple Moving Average (SMA) is a widely used technical indicator in trading that helps smooth out price data to identify trends over a specific period. It calculates the average price of an asset over a set number of time periods and updates continuously as new prices are added.
How to calculate SMA?
Moving Averages is one of the most used technical indicators. It is a simple concept, easy to understand and interpret. It is basically a smoothing device.
Let’s take a simple example where we have closing price of a stock for each trading day.
Moving Average explanation

To calculate the moving average of 5 periods, for March 26th, we average the price of 5 days (Mar 22nd to 26th).
To calculate the moving average of 5 periods, for March 25th, we average the price of 5 days (Mar 19th to 25th).
A couple of parameters in this calculation are
1) Length of the moving average – how many periods to use for calculating average. In the example above, we used 5.
Common moving average lengths are 10, 20, 50, 100 and 200.
If the length is greater, the smoothing effect is greater and the indicator is less impacted by sudden price fluctuations.
2) Source – what value are we averaging. In the example we used the closing price of the stock.
Though Closing price is the most used for calculating simple moving average, you can also use High, Low, Open, and Volume as well.
Signals
Commonly used trading signals using the Moving average method are listed below.
Once again there is no golden rule or a rule that works all the time. Otherwise, everyone will use that rule and make a lot of money easily.
If the closing price moves from below the Moving Average line to above the Moving average line, then a Buy signal is generated.
If the closing price moves from above the Moving Average line to below the Moving average line, then a Sell signal is generated.
What trading signals are observed from SMA indicator?
The template shows the buy and sell signals on the chart.
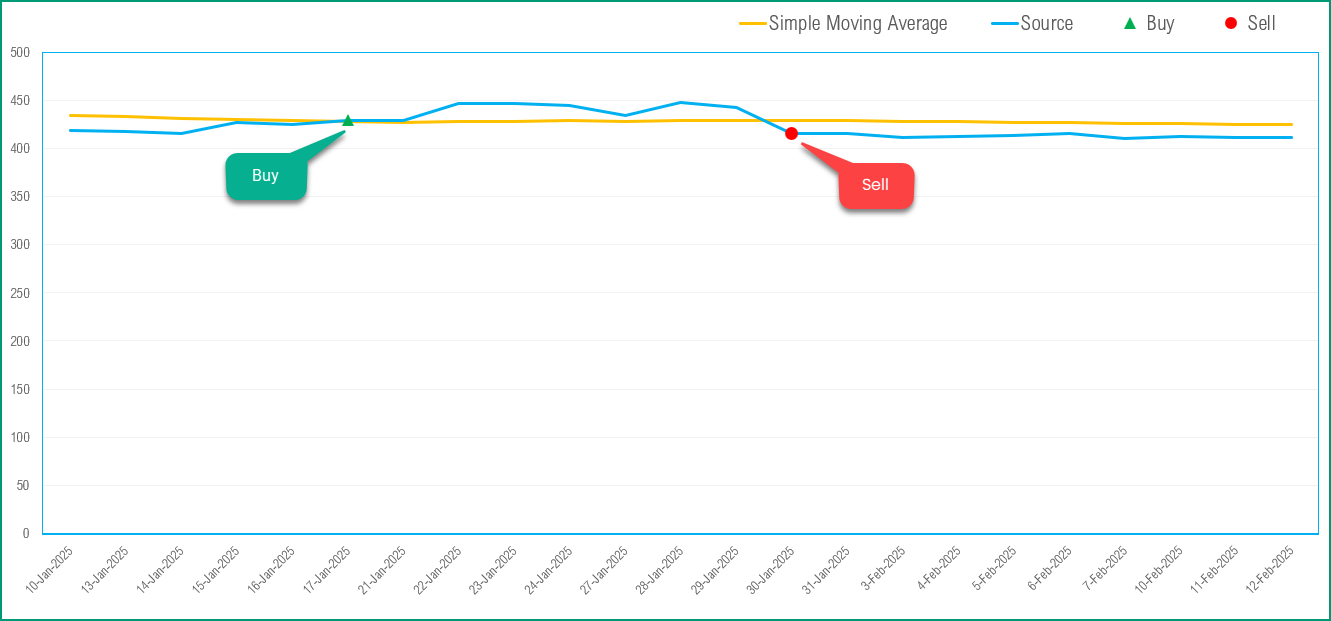
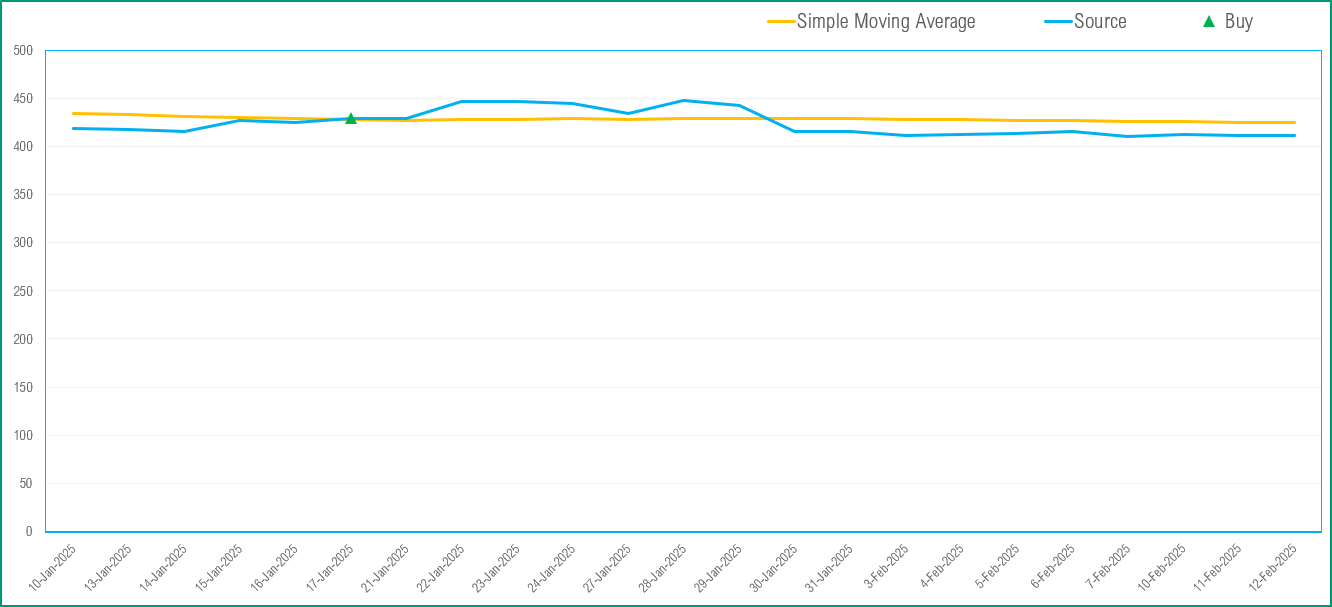
- If the closing price moves from below the Moving Average line to above the Moving average line, then a Buy signal is generated.
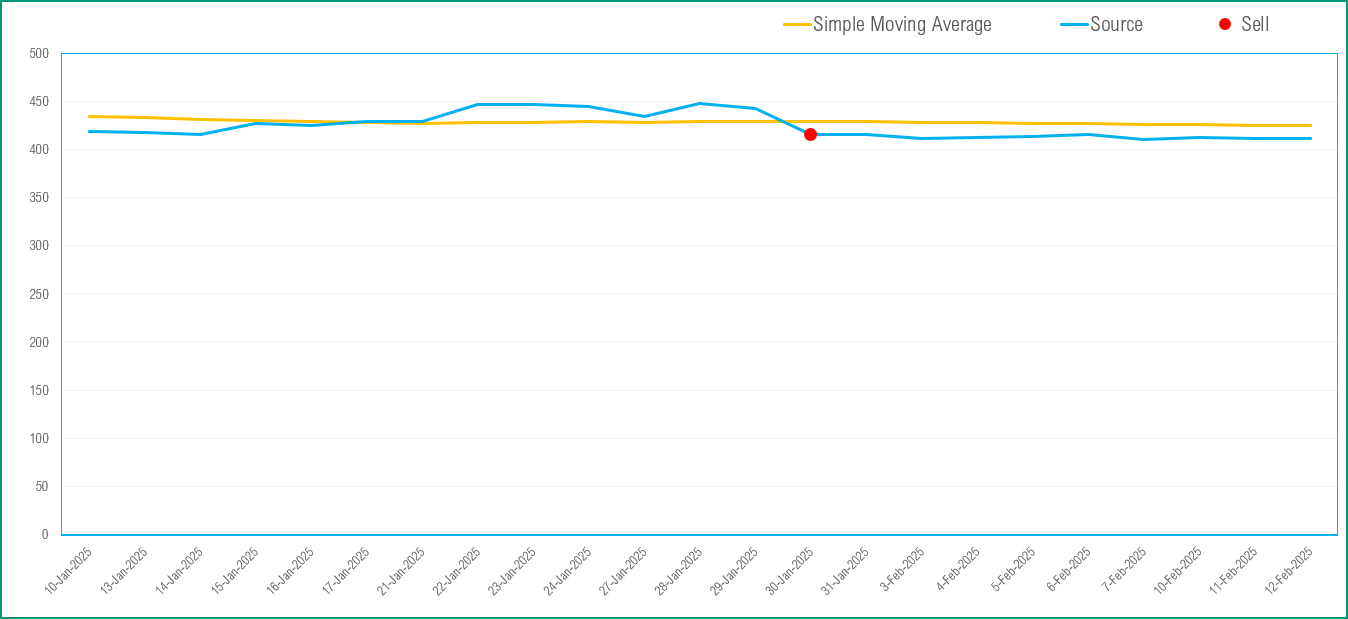
- If the closing price moves from above the Moving Average line to below the Moving average line, then a Sell signal is generated.
- If neither is true, no signal will be generated.
In addition, if the latest day has a Buy or Sell signal, it is displayed on the top next to the current price.
Is there a free version of this template?
We have a free SMA template you can use to calculate SMA indicator for any stock symbol.
SMA Indicator Excel Template - Technical Analysis - Stock Market
Does the template consider fees?
The template assumes no commissions or fees in its profit calculation. If you need any assistance with incorporating this, please contact us.
Can the template handle short trading?
Yes, the template handles short trading actions.
Does it work for international exchanges?
Yes, please see this article for exchanges supported by Microsoft
How does the template decide trading decision?
The template calculates the signal events for each day based on the closing prices. The trade itself will be made on the following day opening of market.
Let's say on a specific day (Jan 14, 2025) there is a Buy Signal Line. Then, the template will initiate a trade on next trading day (Jan 15, 2025) for the Opening price. Trading action (whether to enter or exit a trade and whether it is a Long or Short trade) will depend on what you have chosen in the settings in the template. It's customizable.